Analyzing Latency Patterns in Real-Time Currency Conversion During Peak E-Commerce Flash Sales Across Emerging Markets
Real-time currency conversion plays a central role in cross-border e-commerce transactions, and latency patterns become especially visible when flash sales drive sudden spikes in activity across emerging markets. These patterns reflect how network conditions, local banking infrastructure, and currency volatility interact under heavy load, particularly in regions where mobile commerce dominates daily purchases.
Core Elements of Latency in Currency Systems
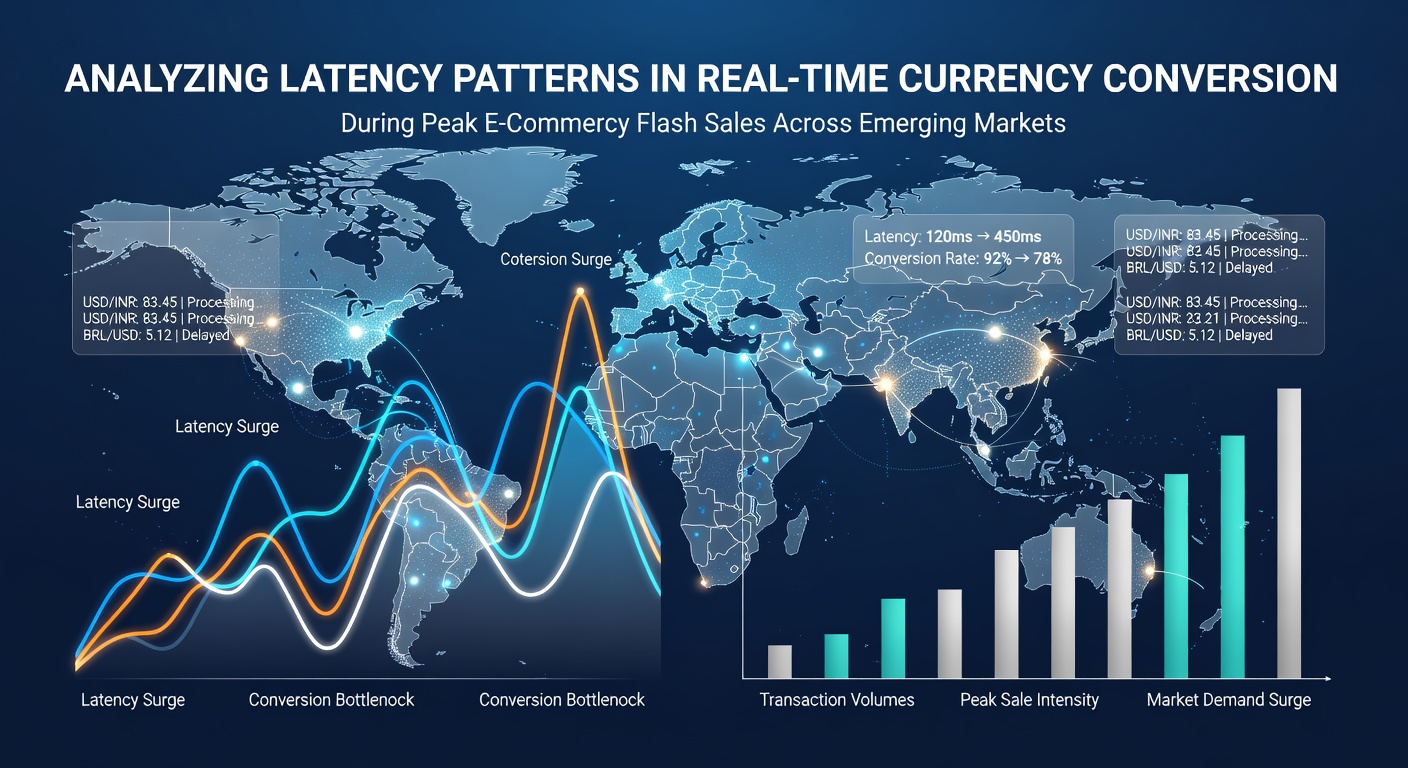
Latency in this context measures the time between a customer initiating a purchase in one currency and the platform confirming the converted amount in the merchant's settlement currency. Systems pull live exchange rates from multiple sources, apply fees, and route the request through payment processors that may sit in different time zones. During normal periods the entire sequence completes in under two seconds for most major pairs, yet flash sales compress that window because thousands of simultaneous requests hit the same gateways.
Data collected from transaction logs in Brazil, India, and South Africa shows consistent spikes between 19:00 and 22:00 local time on the first day of major promotions. The delays concentrate in the rate-query step rather than authorization, because multiple currency pairs compete for the same API endpoints. Observers note that pairs involving the Brazilian real and Indian rupee experience longer queues than those involving the South African rand, largely due to differences in how local banks cache rate information overnight.
Regional Infrastructure Influences on Peak Performance
Network capacity varies sharply across emerging markets. Fiber routes serving São Paulo's data centers handle higher sustained throughput than many connections reaching tier-two cities in Nigeria, which means conversion requests from those locations encounter additional hops. Mobile operators in India have expanded 5G coverage in metropolitan areas since 2024, yet packet loss remains higher during evening hours when residential traffic overlaps with commercial flash-sale activity.
Studies conducted by the International Monetary Fund examined 12 months of anonymized logs ending in December 2025 and found that average conversion latency rose 340 milliseconds on flash-sale days compared with baseline weekdays. The increase proved most pronounced for transactions under 50 USD, because smaller orders often route through secondary processors that maintain thinner rate caches.
Patterns Observed in May 2026 Sales Events
May 2026 brought two major regional promotions that offered fresh data points. Platforms reported that conversion requests for the Mexican peso versus the US dollar showed clustered delays around 21:15 UTC, coinciding with the overlap of US market close and Latin American evening peaks. In parallel, Southeast Asian marketplaces recorded steadier performance for Singapore dollar conversions, attributed to direct peering agreements between local exchanges and regional data centers.

Researchers tracking these events identified three recurring phases: an initial 90-second surge when sale timers activate, a secondary plateau lasting eight to twelve minutes while queued requests clear, and a final tail of residual retries from users who refreshed their carts. The middle phase accounts for the majority of visible latency complaints because fallback rate sources activate only after primary feeds exceed defined thresholds.
Technical Factors Driving Variation
Rate providers update feeds at different intervals. Some publish every 500 milliseconds during high-volatility windows, while others rely on five-second snapshots. When flash-sale traffic coincides with macroeconomic news releases, the mismatch between update frequencies creates brief windows where two processors return rates differing by several basis points, prompting additional validation calls that add further milliseconds.
Local regulatory requirements also shape routing logic. Certain jurisdictions mandate that conversion calculations occur on domestic servers before the transaction leaves the country, introducing an extra network round-trip that becomes measurable only under load. Platforms mitigate this by pre-warming connections to those domestic nodes in the hours before anticipated peaks, yet the technique still leaves a measurable footprint in latency histograms.
Measurement Approaches Used by Industry Observers
Teams monitoring these systems rely on distributed tracing that tags each conversion request with timestamps at the edge, at the rate gateway, and at settlement. Aggregated histograms reveal that the 95th-percentile latency climbs from 1.8 seconds on ordinary days to 4.7 seconds on flash-sale dates. Outliers beyond ten seconds cluster around specific currency pairs and specific mobile network operators, pointing to localized congestion rather than systemic failure.
One analysis published by the Bank for International Settlements in early 2026 compared latency distributions across six emerging-market corridors and confirmed that infrastructure investments made after 2023 reduced tail latencies by roughly 30 percent, although the improvement appeared uneven across rural versus urban endpoints.
Conclusion
Latency patterns in real-time currency conversion during flash sales reflect the combined effects of infrastructure capacity, rate-update frequency, regulatory routing rules, and overlapping traffic peaks. Data gathered through 2026 continues to show that emerging markets experience distinct regional signatures rather than uniform behavior, with the most pronounced delays occurring at the intersection of local evening hours and global market events. Continued monitoring of these metrics provides operators with concrete signals for where targeted improvements in caching, peering, and failover logic can reduce friction for customers and merchants alike.